Infographics
What are and how are they useful?
In their simplest form, infographics use visuals to represent information or data. They can help visualize content by breaking down complex topics and synthesizing information. The use of infographics can increase engagement and improve retention.
Infographics take many forms and can be used to provide step by step instructions, illustrate process, provide visual comparisons, or historical timelines; the applications are broad.
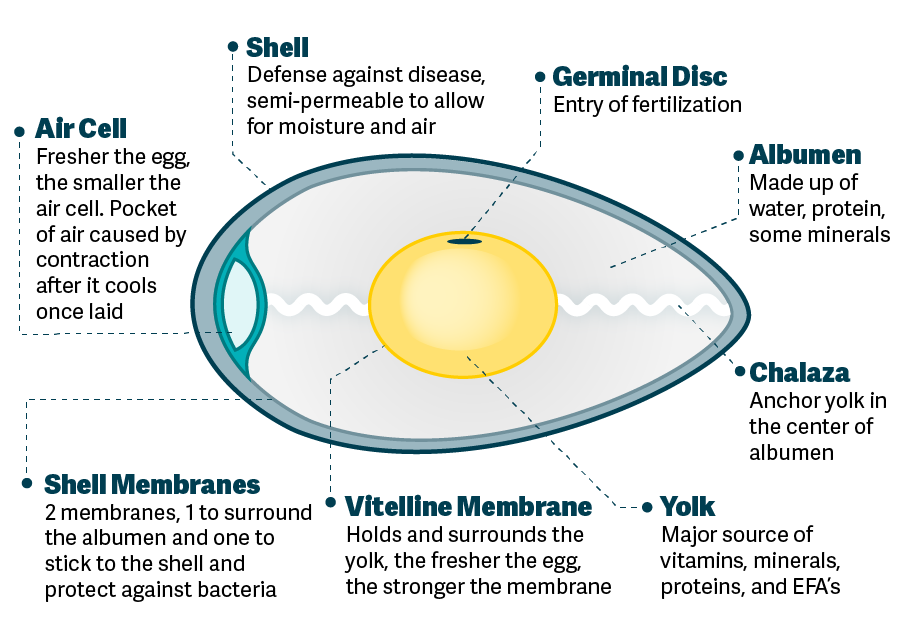
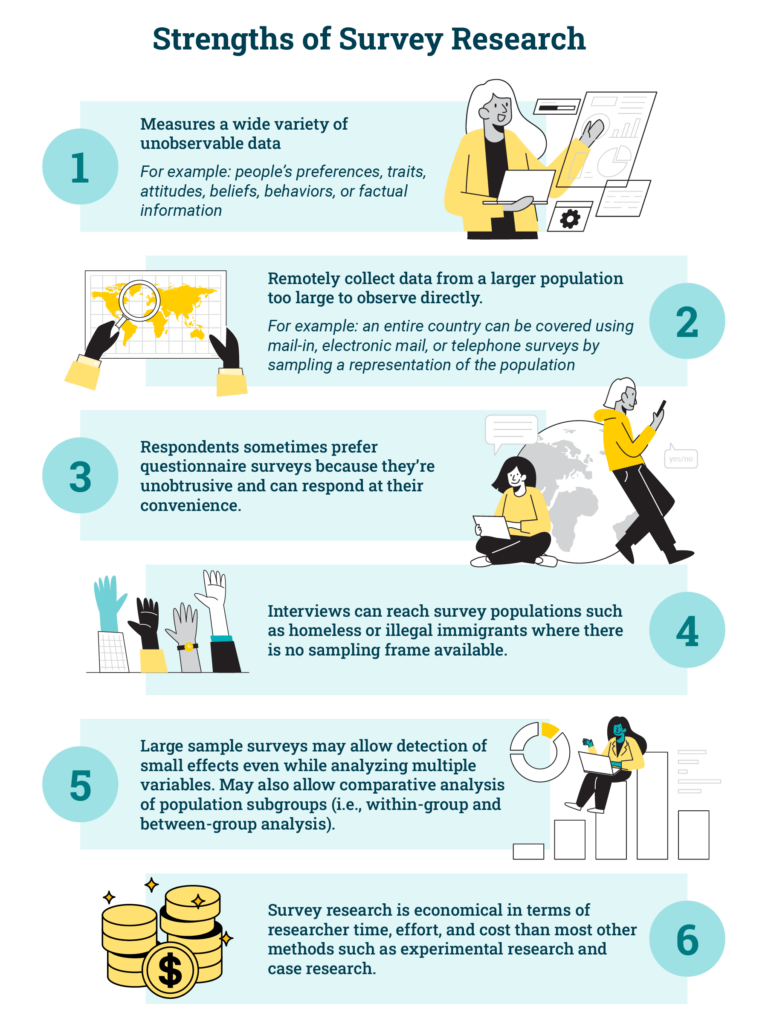
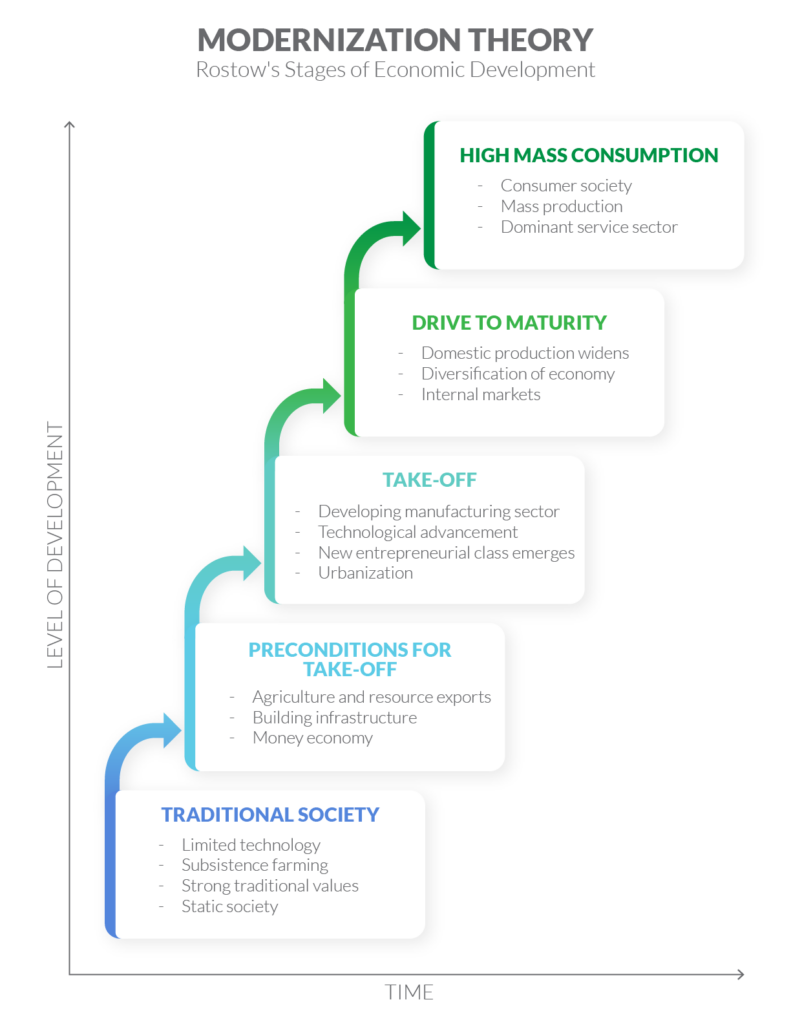
A few examples here demonstrate how infographics can present a diagram (egg), list information (Strengths of Survey Research), visualize a hierarchy of information (Modernization Theory), and provide step by step instructions (tensor wrapping).
Points to consider
- Infographics need a clear subject for representation
- Layout should be well structured allowing readers to enter from multiple spaces
- Cite the use of concepts or images appropriately (APA/MLA)
Evidence for use


